Utilities Just Requested a Record $9.2 Billion in Rate Hikes. Here's How Plug-In Solar Fights Back.
By PlugInSolarUS Editorial · Published 2026-08-02 · 10 min read
U.S. utilities requested a record $9.2 billion in rate increases in Q2 2026 alone. With 1 in 6 households already behind on bills, plug-in solar offers a direct, no-permission-needed hedge against rising electricity costs.
Listen: Put the $9.2 billion rate-request figure in context
Hear the companion episode of Plug-In Solar, Explained from PlugInSolarUS.
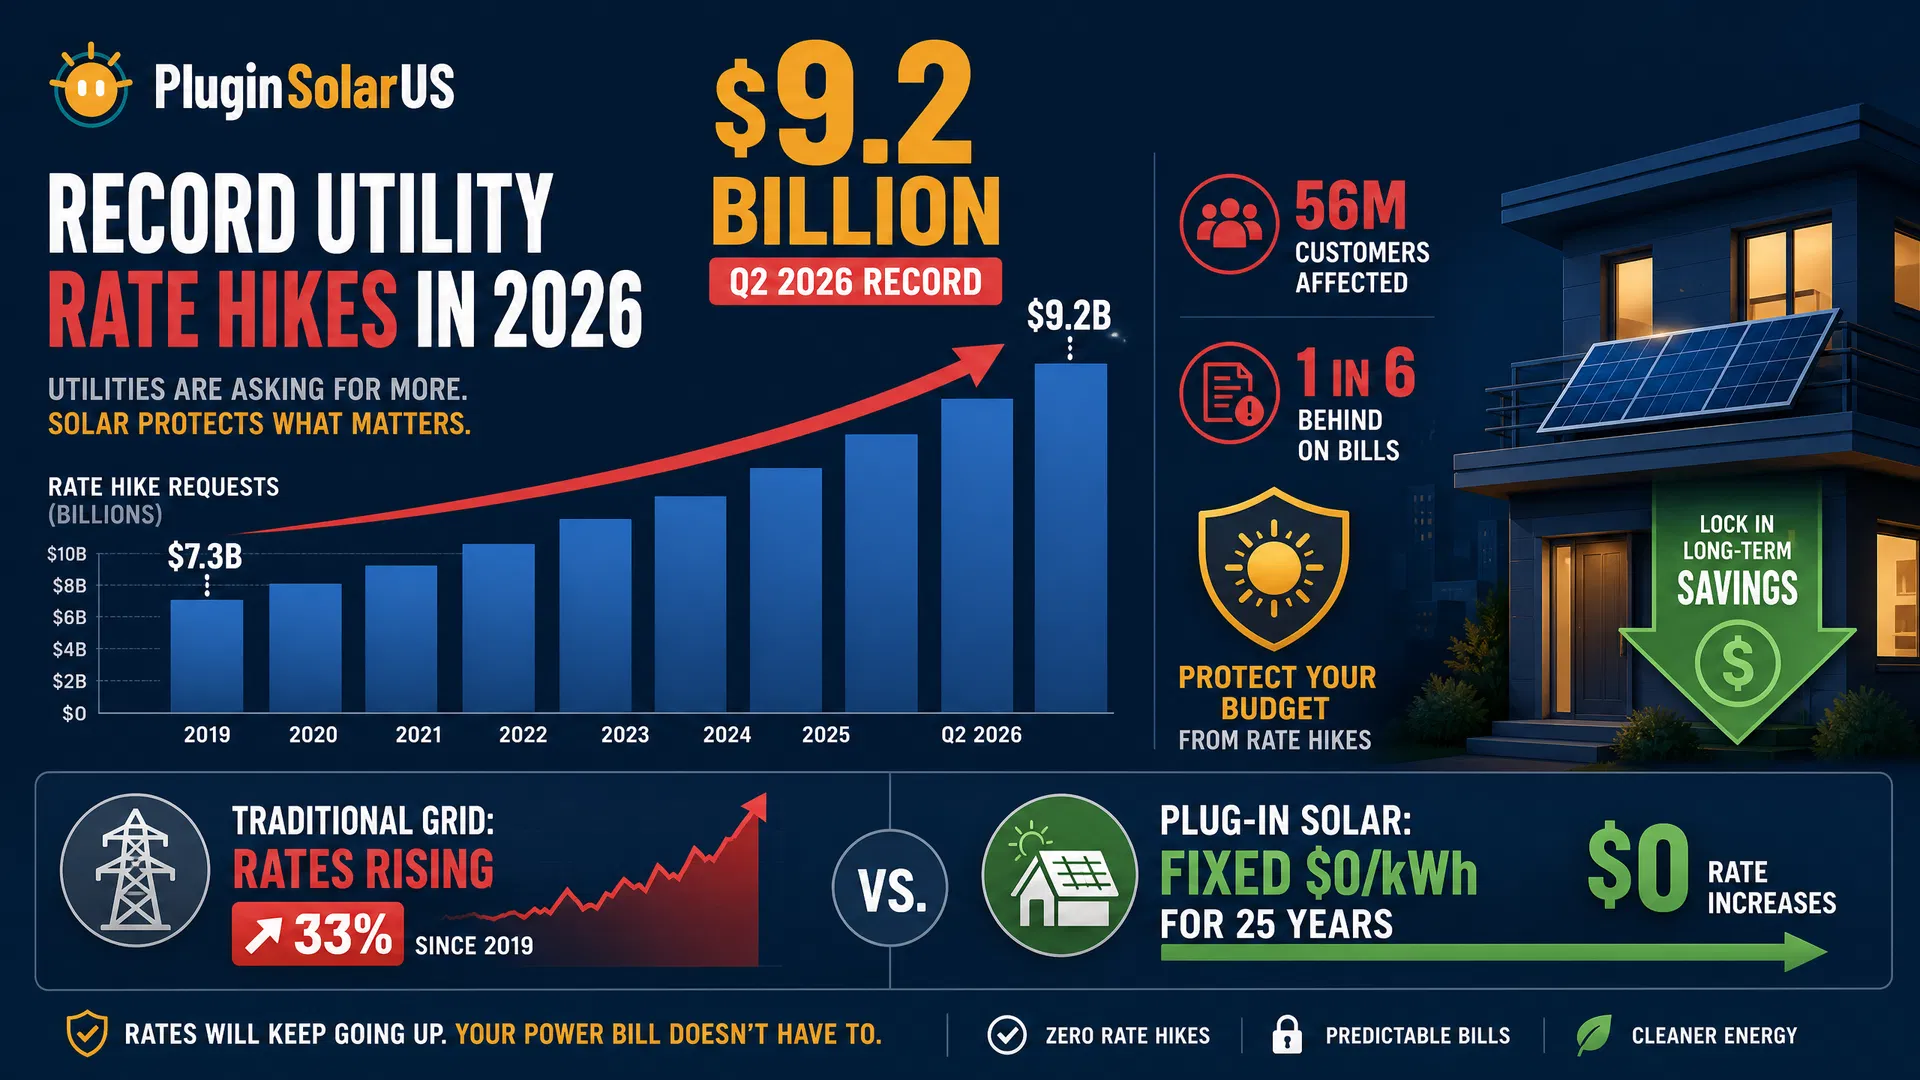
In the second quarter of 2026, U.S. electric and gas utilities asked state regulators to approve $9.2 billion in rate increases — a new quarterly record that surpasses the previous high by 26%. According to the consumer advocacy group PowerLines, those requests could affect more than 56 million American customers. And this is just one quarter: total rate hike requests for the first half of 2026 have already topped $18.6 billion.
For the estimated one in six American households already behind on their utility bills, these numbers are not abstract. They represent the difference between keeping the air conditioning on during a heat wave and choosing between electricity and groceries. But there is a technology that lets consumers fight back — without asking permission from the very utilities raising their rates.
The Numbers: A Rate Hike Tsunami
The PowerLines report, released July 14, 2026, paints a stark picture of the utility affordability crisis accelerating across the country. Since 2021, utilities have dramatically increased both the frequency and size of their rate requests.
| Metric | Value | Context |
|---|---|---|
| Q2 2026 rate requests | $9.2 billion | New quarterly record, up 26% from previous high |
| H1 2026 total requests | $18.6 billion | Already exceeds full-year 2025 total ($18B) |
| Customers affected (Q2) | 56 million | Roughly 1 in 3 utility customers nationwide |
| Rejection rate (2025) | 2 of 83 requests | Regulators rarely say no outright |
| Approval rate (2021–2025) | 64% of dollar value | LBNL finding: most of what’s asked for gets approved |
| Households behind on bills | 1 in 6 | NEADA, June 2026 |
Where Rates Are Rising Fastest
The pain is not distributed evenly. Southern states account for the largest share of requested increases ($4.5 billion affecting 26 million customers), followed by the Midwest ($2.7 billion, 14 million customers) and the West ($1.5 billion).
A separate Lawrence Berkeley National Laboratory (LBNL) report published the same week found that since 2019, nominal residential electric rates have risen 33% nationally. The states hit hardest read like a who’s-who of plug-in solar legislation:
| State | Rate Increase Since 2019 | Current Avg. Rate | Plug-In Solar Status |
|---|---|---|---|
| California | +6¢/kWh (inflation-adjusted) | ~34¢/kWh | Pending legislation |
| Maine | +4¢/kWh | ~26¢/kWh | Enacted (LD 1986) |
| New York | +2¢/kWh | 29.45¢/kWh | On Governor's Desk (SUNNY Act) |
| New Jersey | +2¢/kWh | ~22¢/kWh | On Governor's Desk (S3773) |
| Connecticut | +2¢/kWh | ~27¢/kWh | Enacted (HB 5340) |
| Maryland | +2¢/kWh | ~19¢/kWh | Enacted (HB 1532) |
This is not a coincidence. Legislators in these states are responding to the same affordability crisis that the rate data reveals. Plug-in solar legislation passes because voters are angry about their electricity bills.
The Biggest Offenders
Several utilities stand out for the sheer scale of their requests:
- Oncor (Texas): $1.2 billion — the single largest request of Q2, driven by a 5-year plan to serve data centers and oil/gas operations
- Dominion Energy (Virginia): $1.5 billion across three separate filings, including $1.1 billion in unrecovered fuel costs
- DTE Energy (Michigan): ~$500 million
- Consumers Energy (Michigan): ~$500 million
- Duke Energy (Florida): 24% increase already approved
- Ameren (Illinois): 18% increase already approved
Notice a pattern: much of the spending is driven by infrastructure for data centers and AI facilities — costs that are being socialized across all ratepayers, including residential customers who derive no direct benefit from these investments.
Why Regulators Rarely Say No
PowerLines’ analysis of 2025 rate cases found that regulators rejected just 2 out of 83 requests outright. Over the 2021–2025 period, LBNL found that state commissions approved 64% of the dollar value requested. While regulators often trim requests, the fundamental dynamic is clear: utilities ask, and most of what they ask for eventually flows through to your bill.
The Edison Electric Institute, representing investor-owned utilities, argues that as much as 25% of consumer bills are driven by “regulatory bureaucratic red tape.” But that framing sidesteps the core issue: consumers have almost no leverage in rate proceedings, and the regulatory process is structurally tilted toward approval.
The Plug-In Solar Hedge
This is where plug-in solar enters the picture — not as a complete replacement for grid power, but as a direct consumer hedge against rate volatility. Consider the math:
The Simple Math
An 800W plug-in solar system in New York (29.45¢/kWh) generates approximately 900–1,100 kWh per year.
Annual savings: $265–$324 at current rates
System cost: $400–$800 (no installation labor)
Payback period: 1.2–3 years
After payback: Every kWh generated is pure savings — and those savings grow as rates increase
Unlike a traditional rooftop solar installation that requires $15,000–$30,000 upfront, months of permitting, and a 7–10 year payback, plug-in solar delivers returns in months. And critically, it requires no utility approval — you are not asking the same entity raising your rates for permission to reduce your dependence on them.
The Rate Hike Accelerator Effect
Here is the dynamic that makes plug-in solar increasingly attractive: as rates rise, the value of every kilowatt-hour you generate yourself increases proportionally. A system that saves you $265/year at 29.45¢/kWh will save you $310/year if rates climb to 34.5¢/kWh — a scenario that LBNL’s data suggests is entirely plausible within 2–3 years for Northeast states.
This creates what economists call a natural hedge: the worse the rate environment gets, the more valuable your plug-in solar system becomes. Unlike fixed-rate energy contracts (which utilities can break or renegotiate), your solar panels keep producing at zero marginal cost for 25+ years.
Who Benefits Most
| Household Type | Why Plug-In Solar Helps | Estimated Annual Savings |
|---|---|---|
| Renters | No roof access needed; takes it when you move | $150–$300 |
| Low-income households | Lowest upfront cost of any solar; no credit check | $150–$300 |
| Apartment dwellers | Balcony or patio installation; no landlord approval in enacted states | $100–$250 |
| Homeowners (high-rate states) | Immediate offset while planning larger system | $200–$400 |
| Fixed-income seniors | Predictable savings; no maintenance; 25-year lifespan | $150–$300 |
The Affordability Crisis Is a Policy Failure
The NEADA reports that one in six American households are behind on utility bills. LBNL found that one-third of households earning less than $50,000 per year now pay at least 5% of their income toward electricity alone. These are not edge cases — they represent tens of millions of families for whom every rate increase is a material hardship.
The traditional policy response — energy assistance programs like LIHEAP — treats the symptom, not the disease. Plug-in solar offers something different: a permanent reduction in energy dependence that compounds over time. A $500 system that saves $250/year delivers $6,250 in lifetime savings at current rates — and significantly more as rates continue to climb.
What You Can Do
Action Steps
- Check your state’s status — Use our State Tracker to see if plug-in solar is legal where you live
- Calculate your savings — Our Savings Calculator uses real EIA rate data for your zip code
- Contact your state representative — If your state hasn’t enacted plug-in solar legislation, let them know you support it
- Document your bills — Track your monthly costs to quantify the impact of rate increases
- Join the movement — Every household that adopts plug-in solar reduces peak demand and helps stabilize the grid for everyone
The Bottom Line
The $9.2 billion in Q2 rate requests is not an anomaly — it is the new normal. Utilities are investing billions in infrastructure for data centers, wildfire mitigation, and grid modernization, and those costs are being passed directly to consumers. Regulators approve the vast majority of what’s requested. The trajectory is clear: your electricity bill is going up, and it is going to keep going up.
Plug-in solar does not eliminate your electricity bill. But it gives you something no utility program, no rate freeze, and no energy assistance check can provide: permanent, growing, self-directed savings that require no one’s permission and no one’s approval. In an era of record rate hikes, that independence has never been more valuable.
Data sources: PowerLines Q2 2026 Rate Report; Lawrence Berkeley National Laboratory 2026 Retail Price Trends Update; National Energy Assistance Directors Association (NEADA) Summer Cooling Update; U.S. Energy Information Administration (EIA) Electricity Monthly Update, May 2026; Empire Center analysis of EIA data. Savings estimates use PlugInSolarUS calculator methodology based on EIA state-level rate data and NREL solar irradiance figures.
Sources
- Stateline: Utilities Request Billions in Rate Hikes (July 2026)
- Utility Dive / LBNL: Retail Electric Rate Increases Outpace Inflation
- PowerLines: Utility Bills Are Rising
- NEADA: Summer Cooling Update (June 2026)
- EIA: Electricity Monthly Update (May 2026)
- Empire Center: New York Electricity Prices (July 2026)