How We Calculate Plug-In Solar Savings: Our Methodology
By PlugInSolarUS Editorial Team · Published 2026-02-01 · Updated April 2026 · 8 min read
Most plug-in solar savings calculators are optimistic. Here's exactly how we calculate savings — and why we show more conservative estimates than most brands.
How We Calculate Plug-In Solar Savings: Our Methodology
At PlugInSolarUS, our mission is to empower homeowners and renters with clear, actionable insights into the benefits of plug-in solar. Our savings calculator is a cornerstone of this mission, designed to provide realistic and personalized estimates of your potential energy bill reductions. This article delves into the methodology behind our calculations, explaining the key variables, system sizing impacts, and what our model does and does not account for.
Understanding these factors will help you interpret your savings projections more accurately and make informed decisions about your plug-in solar journey.
Understanding Our Savings Calculator Methodology
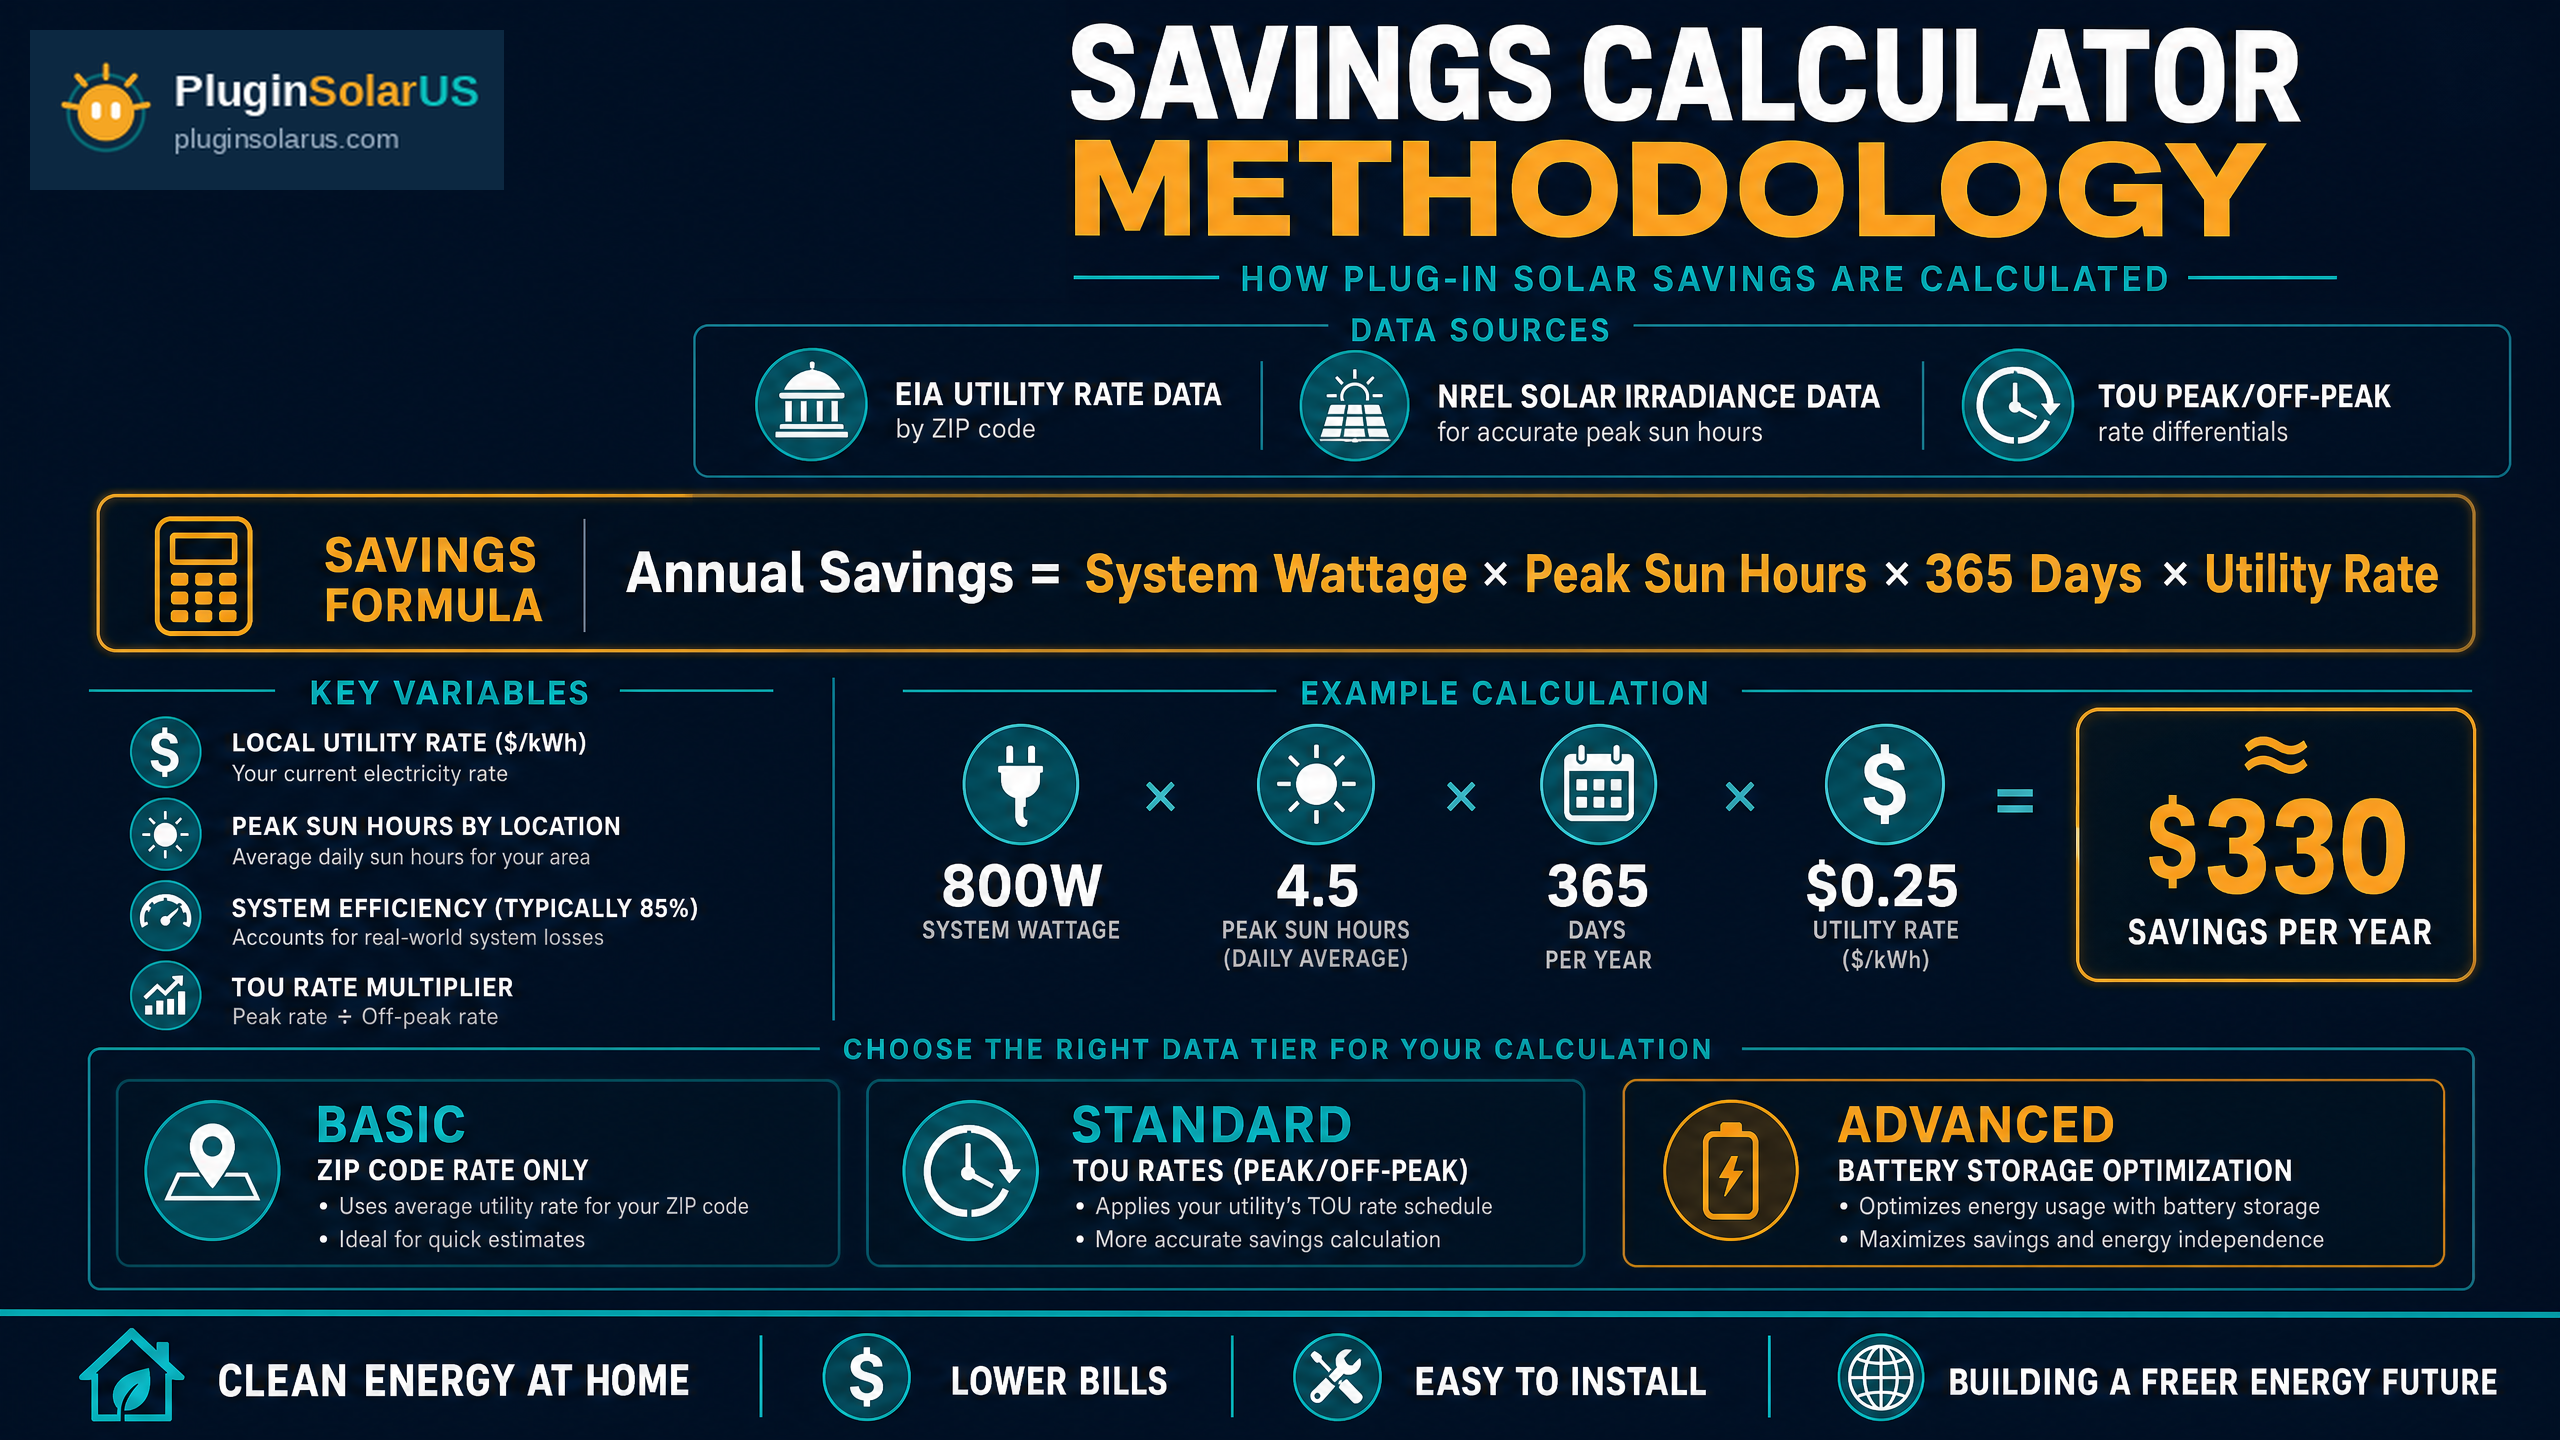
Our calculator employs a robust methodology that considers several critical variables to project your potential savings. Each input plays a vital role in determining the overall financial benefit of your plug-in solar system.
Key Input Variables
- Your Current Electricity Rate: This is perhaps the most significant variable. We use your average electricity rate per kilowatt-hour (kWh) to determine the value of the electricity your system generates. Higher rates naturally lead to greater savings. Our calculator allows you to input your specific rate, but we also provide national and state averages for estimation. For instance, the national average is currently around $0.18/kWh, while states like California see rates closer to $0.34/kWh, Massachusetts at $0.32/kWh, and Connecticut at $0.28/kWh.
- System Size (Panel Wattage): This refers to the total rated power output of your solar panels. A larger system can generate more electricity, leading to higher potential savings. Our calculator considers three primary sizing tiers:
- Starter Systems: Typically 400–1,200W of panels, ideal for offsetting minimal loads or for those new to solar.
- Mid-Range Systems: Ranging from 800–1,600W, offering a more substantial contribution to household electricity needs.
- High Output Systems: With 1,600–2,400W+ of panels, these systems are designed for maximum energy offset and greater independence.
- Battery Capacity: While not all plug-in solar systems include batteries, integrating storage significantly enhances savings, especially in areas with Time-of-Use (TOU) rates. Batteries allow you to store excess solar generation for use during peak demand periods when electricity is most expensive. Our calculator models common battery capacity tiers:
- Entry: 1–2 kWh
- Standard: 2–3 kWh
- Extended: 3–5 kWh+
- Solar Production Profile: This accounts for the amount of sunlight your location receives, panel orientation, shading, and local weather patterns. Our model uses historical solar irradiance data for your specific geographic area to estimate monthly and annual energy production. Factors like panel tilt and azimuth are also considered for a more accurate projection.
- Household Consumption Profile: Understanding when and how much electricity your household consumes is crucial. Our calculator can use your historical usage data (if provided) or estimate based on typical household consumption patterns for your region. This helps us determine how much of your solar generation is directly consumed (offsetting purchases from the grid) versus potentially exported (if net metering is available).
Impact of System Sizing Tiers on Calculations
The chosen system sizing tier directly influences the projected energy production and, consequently, your savings. Each tier is designed to meet different levels of energy demand and budget considerations.
- Starter Systems (400–1,200W panels + 1–2 kWh battery): These systems are best suited for individuals looking to dip their toes into solar, or for those with very low energy consumption. The savings will be modest but noticeable, primarily offsetting base loads like lighting, charging devices, or small appliances. The smaller battery capacity provides basic evening power or backup for critical loads.
- Mid-Range Systems (800–1,600W panels + 2–3 kWh battery): This tier offers a balanced approach, providing significant energy offset for typical apartment or small home consumption. Savings become more substantial, especially when paired with a standard battery to optimize for TOU rates. This size often represents a sweet spot for cost-effectiveness and energy independence.
- High Output Systems (1,600–2,400W+ panels + 3–5 kWh+ battery): Designed for maximum energy production, these systems can significantly reduce or even eliminate electricity bills for many households. The larger battery capacity allows for extended off-peak usage or more robust backup capabilities, maximizing savings through arbitrage in TOU markets.
Worked Examples: State-Specific Savings Projections
To illustrate how these variables translate into real-world savings, let's examine three hypothetical scenarios:
California Example (High Rates, TOU Optimization)
Scenario: Mid-Range System (1,200W panels, 3 kWh battery) in California, average electricity rate $0.34/kWh with significant TOU differentials.
In California, high electricity rates and prevalent Time-of-Use (TOU) billing make battery storage particularly valuable. A 1,200W system could generate approximately 1,800 kWh annually. With a 3 kWh battery, excess solar generated during the day can be stored and discharged during expensive evening peak hours, maximizing bill credits. This strategy significantly reduces the payback period.
| Metric | Value |
|---|---|
| Annual Production | ~1,800 kWh |
| Annual Savings (estimated) | $550 - $700 |
| Estimated Payback Period | 3-5 years (with TOU optimization) |
Texas Example (Moderate Rates, High Solar Irradiance)
Scenario: Mid-Range System (1,200W panels, no battery) in Texas, average electricity rate $0.14/kWh (lower than national average).
Texas benefits from abundant sunshine, leading to high solar production. While electricity rates are generally lower than in California, a 1,200W system can still generate substantial energy, around 1,900 kWh annually. Without a battery, savings come purely from direct consumption offset and any available net metering.
| Metric | Value |
|---|---|
| Annual Production | ~1,900 kWh |
| Annual Savings (estimated) | $250 - $350 |
| Estimated Payback Period | 6-8 years |
National Average Example (Typical Rates, Standard Conditions)
Scenario: Starter System (600W panels, 1 kWh battery) in a location with national average electricity rate $0.18/kWh.
For a typical US household considering a starter system, the savings are more modest but still contribute to reducing energy costs. A 600W system might produce around 900 kWh annually. The 1 kWh battery provides some flexibility for evening use or basic backup.
| Metric | Value |
|---|---|
| Annual Production | ~900 kWh |
| Annual Savings (estimated) | $150 - $200 |
| Estimated Payback Period | 7-9 years |
What Our Calculator Does NOT Model
While our calculator provides a robust estimate, it's important to understand its limitations and what it does not explicitly model:
- Solar Panel Degradation: Solar panels naturally degrade over time, typically losing 0.5% to 1% of their efficiency per year. Our calculator does model panel degradation at 0.5% per year — this rate is applied to each year in the 10-year and 25-year return projections, so long-term savings estimates already account for the gradual decline in output over the system's lifespan.
- Electricity Rate Escalation: Historically, electricity rates tend to increase over time. Our calculator uses your current or estimated rate. It does not project future rate increases, which would likely make your solar savings even greater in the long run.
- Maintenance Costs: Plug-in solar systems are generally low-maintenance, but occasional cleaning or component checks are not factored into the savings.
- Inflation: The purchasing power of money changes over time. Our calculator presents savings in today's dollars.
- Specific Local Incentives (beyond federal): While we account for general energy costs, highly localized incentives (e.g., specific utility rebates or municipal programs) are not universally integrated. Always check with your local utility and government for additional programs.
Important Considerations and Regulatory Landscape
Navigating the world of plug-in solar requires an understanding of both technical requirements and the evolving regulatory environment.
Critical Safety and Regulatory Notice
Plug-in solar systems MUST connect to a GFCI-protected outlet on a dedicated circuit. This is not merely a recommendation but a critical safety requirement. Connecting to a standard, non-GFCI outlet or a shared circuit can pose significant risks. Relevant safety standards include UL 3700 for plug-in grid-interactive power conversion equipment, which is a crucial safety standard referenced in most pending state bills and enacted in Maine's LD 1730 (2026). Utah's HB 340 (2025) references UL 1741 for inverter certification. Furthermore, NEC Articles 690 and 705 (not Article 625, which pertains to EV charging) provide the foundational electrical code for these installations.
Federal and State Policy Landscape
- Federal ITC (Investment Tax Credit): The 30% Federal Investment Tax Credit for solar systems expired on December 31, 2025, for new purchases. While it is no longer available for systems bought in 2026 and beyond, those who purchased systems in 2025 can still claim it on their 2025 tax returns.
- California SB 868 (Plug and Play Solar Act, 2026): This significant bill, aimed at streamlining plug-in solar adoption, passed the full California Senate 35-1 on May 20, 2026 and is now in the Assembly. However, it is important to note that it is NOT yet enacted into law. (Note: AB-2316 was a community solar bill and is unrelated to plug-in solar.)
- Utah HB 340 (2025): Utah was the first state to explicitly legalize plug-in solar, exempting systems under 1,200W from interconnection permits.
- Maine LD 1730 (April 6, 2026): Maine became the second enacted state. Governor Janet Mills signed LD 1730, allowing systems up to 1,200W with a two-tier structure (≤420W DIY; >420W requires a licensed electrician).
- Virginia, Maryland, and Colorado: All three signed plug-in solar bills into law in April–May 2026, joining Utah and Maine as enacted states. See our State Tracker for live status.
Payback Periods and Electricity Rates
The financial viability of plug-in solar is often measured by its payback period – the time it takes for your energy savings to equal the initial investment. The national average payback period for plug-in solar systems is typically 5–7 years. However, in high-rate states like California, Massachusetts, and Connecticut, with strategic Time-of-Use (TOU) optimization (often facilitated by battery storage), payback periods can be as short as 3–5 years.
Current electricity rates are a primary driver of these payback periods:
- National Average: ~$0.18/kWh
- California (CA): ~$0.34/kWh
- Massachusetts (MA): ~$0.32/kWh
- Connecticut (CT): ~$0.28/kWh
These rates underscore why plug-in solar offers more immediate and substantial financial benefits in regions with higher energy costs.
Next Steps
Ready to explore your personal plug-in solar savings? Our tools are designed to guide you through every step of the process:
- Calculate Your Savings: Use our interactive tool to get a personalized estimate for your home. Plug-In Savings Calculator
- Deep Dive into Batteries: Understand how battery storage can maximize your savings and energy independence. Plug-In Solar Battery Guide
- Explore Your Options: Find the right system for your needs with our comprehensive guide. Plug-In Solar Buyer's Guide